

The previous post was about getting other people's code to run on this chip. It was four months of dispatch fixes and attention kernels upstreamed into flash-attention, FlashInfer, vLLM, SGLang, CUTLASS, and Triton, so that pip installand serve became a thing you could do on a DGX Spark. That work answered whether the open stack runs on consumer Blackwell. This post is about the part that came after, and the reason it came after. Porting the stack is what showed me exactly where the toolchains still fall short on this chip, and sm121-kernels is the library I wrote to fill those gaps. It is flash attention, GEMM, and gated-delta-net kernels for SM121, written as hand-written PTX, assembled to SASS by ptxas at build time, and dispatched from Rust with no runtime dependency beyond the CUDA driver.
The thesis is one sentence, and it cuts both ways: hand-written PTX wins where the compiler toolchain has a gap, and loses where the toolchain is mature.The FP8 section is the win. The BF16 section is the loss, measured as carefully as the win.
A note on terms before the marketing instinct kicks in. "Consumer Blackwell" is not one chip. The flagship attention work of the last year (FlashAttention 4, CUTLASS's CuTe DSL kernels, ThunderKittens 2.0) targets sm_100, the datacenter Blackwell, and is built on the tcgen05 matrix instructions and a tensor-memory hierarchy that the consumer part does not have. SM121 allows 99 KB of shared memory per thread block where SM100 allows about 227, exposes the SM80-generation mma.sync warp-level MMA where SM100 has WGMMA and tcgen05, gives 256 registers per thread, and has a 1×1×1 cluster shape, which means no multicast TMA. It is a different chip wearing the same brand, a point backend.ai's teardownand gau-nernst's tcgen05 walkthrough both make in detail, and one I learned the hard way in the previous post by arguing the opposite in a pull request and getting corrected. Every kernel decision below is downstream of those constraints.
Hand-Written PTX, and Why
There is a spectrum of how close to the metal you write a GPU kernel. CUDA C++ is the common floor. CuTe DSL and Triton sit above it as kernel generators that emit PTX for you. PTX is the virtual ISA below all of them, and below PTX is SASS, the actual machine code the hardware runs. Almost everyone targeting SM121 writes near the top of that spectrum. I went down to PTX, for two reasons.
The first is that there is nowhere lower to go. SASS is where the final scheduling and register-bank decisions land, but no open assembler exists for Blackwell SASS (CuAssembler, the one community SASS assembler, stops at SM86), so you cannot hand-write or patch it. PTX is the lowest level you can actually author. From PTX, ptxas still makes the final scheduling and register-allocation calls, so the craft is not controlling every instruction. It is shaping the PTX to coerce ptxastoward the SASS you want, reading the result back with nvdisasm, and iterating. This is the same approach gau-nernst used to reach near-peak BF16 on the 5090 with Ampere-era instructions, and it is the only lever you have on a chip with no SASS assembler.
The second reason is the gap. On a chip the flagship toolchains skipped, their code generation has holes. The sharpest is that CUTLASS's CuTe DSL cannot lower the FP8 MMA instruction on SM120 at all, tracked as CUTLASS issue #3044and still open as of this writing. When the compiler backend can't emit the instruction your hardware has, "write better C++" doesn't help. You drop to the level where you can emit it yourself.
The cost is real. Hand-writing PTX gives up the compiler's software pipelining, its register allocation, and its instruction scheduling, and on the paths where those are mature you will lose to them. That is exactly what happens in BF16, later in this post. So this is not a claim that hand-written PTX is a better way to write kernels. It is a claim that it is the right tool for one specific job: shipping the kernel the toolchain has not shipped yet, on hardware it has not caught up to.
The packaging follows from the same minimalism. Each kernel is a .ptx file, preprocessed for shared macros, assembled to a cubin by ptxas at build time, embedded in the binary, and launched through cudarc. The runtime dependency is libcuda.so and nothing else: no CUDA toolkit, no PyTorch, no Python. That is not a performance claim, but it is what makes the kernels drop into a serving binary cleanly, which is where they actually run.
Maintaining Hand-Written PTX at 296 Files
The first objection to a hand-PTX library is maintenance, and it's a fair one: 296 .ptx files is a lot of assembly. Nearly all of it is written by hand, and that is the work: close to 280 distinct kernels (.visible .entry points) are what this library is. What a generator takes off your plate is not the kernels themselves, but the variant multiplication stacked on top of a few of them.
Flash attention is the worst offender. One implementation has to ship as a cross-product of causal vs non-causal, GQA, paged KV, split-KV, head dimension, and device-side position, and those variants are nearly identical. The fa_bf16_v3family's seven differ by about 6% of their lines; +causal is a 122-line delta on a 1991-line body. Hand-maintaining seven near-copies and keeping them in sync as the shared body changes is exactly the error-prone busywork worth automating, so one .ptx.in template carries the body with the deltas behind #ifdef SPARK_CAUSAL / SPARK_GQA / SPARK_PAGED guards and the build emits each concrete variant. It runs through the same cpp -P preprocessor the macros already use, with no new toolchain.
What the generator does not do is write kernels. The implementation generations (v3 vs v11 vs v21 are different algorithms, not toggles) and every one-off primitive (the GEMMs, MLA, GDN, Mamba-2, the elementwise and training kernels) are authored by hand, instruction by instruction. The generator removes the copy-paste-toggle tax on the handful of families that explode combinatorially. It does not remove the engineering, and the engineering is the bulk of it. The reason the refactor is even safe to do is that ptxas is deterministic: assembling identical PTX twice yields a byte-identical cubin, so the acceptance gate for a generated variant is cmp on the cubin. A match proves it is the exact kernel the production binary already shipped, bit for bit. A maintainability refactor that can't change behavior is the kind you can run against a library serving real traffic.
Flash Attention in FP8, Where the Compiler Can't Follow
SM120 has the FP8 tensor-core instruction. mma.sync.aligned.m16n8k32 ... kind::f8f6f4 is in the ISA, the same mma.sync family the BF16 path uses with double the K dimension (32 instead of 16, because the operands are one byte instead of two). What the chip doesn't have is a compiler that will emit it. CUTLASS's CuTe DSL, the path most people reach for to build a Blackwell FP8 kernel, can't lower FP8 MMA for SM120; the gap lives in the closed-source MLIR backend (#3044). The C++ CUTLASS headers do define the SM120 FP8 MMA atom, so the instruction itself is reachable, but no FP8 flash-attention kernel is built on it and the ergonomic path you would use to write one can't compile the MMA. The most-cited consumer-Blackwell flash-attention writeup, gau-nernst's speed-of-light FA for the 5090, is BF16 only, with FP8 listed under future work. So the practical state of exact FP8 flash attention on SM120 (the kind that takes FP8 Q/K/V in and runs the softmax inside the kernel) is that the open toolchain mostly doesn't produce it. cuDNN does, through its own closed kernels. Below that, you write the MMA yourself.
That is what I did, and it took twelve versions to get right.
The Climb: 10 to 108 TFLOPS
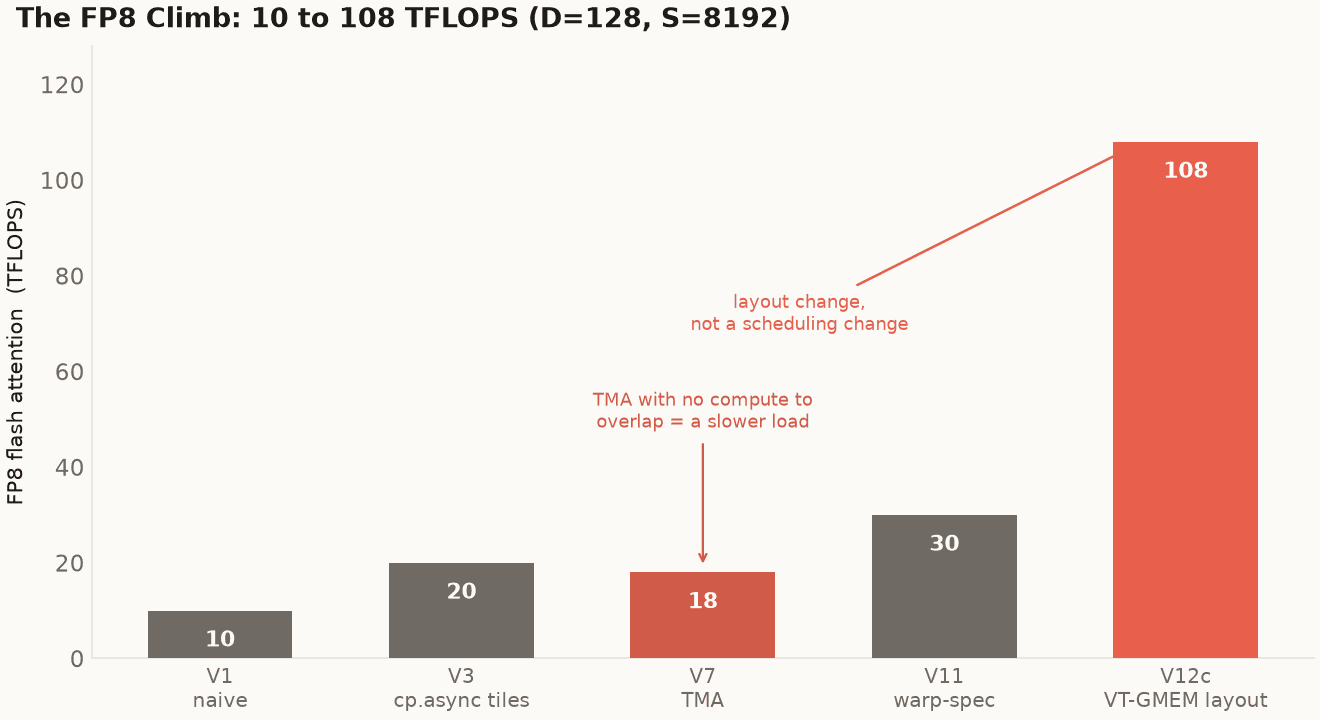
The FP8 flash-attention kernel over its rewrites, D=128, S=8192, sm_121a. The first jumps came from the standard playbook (tiling, async copy, warp specialization). The 30-to-108 jump came from a data-layout change, not a scheduling one. V7 is the cautionary point: a first pass at TMA regressed, because a bulk copy with no compute to overlap is just a slower load.
The first version was the textbook one: every thread loads its operands, every thread computes, no overlap. 10 TFLOPS, entirely memory-latency-bound. The tensor cores spend most of their time waiting for ld.global. Bigger tiles plus cp.async.cg register-bypass loads (V3) doubled it to 20 by getting more arithmetic per byte fetched and letting loads run ahead of compute. Then I tried TMA (V7), expecting the hardware bulk-copy engine to help, and it regressed to 18. That is the first lesson on the board: TMA is not free. A cp.async.bulk.tensor with no compute scheduled to overlap it is just a higher-latency load with more setup; without warp specialization to hide it behind the MMA, the descriptor machinery costs more than it saves. Warp specialization (V11) is what made TMA pay: one DMA warp issues the bulk copies into a shared-memory buffer, four MMA warps consume it, and an mbarrier arrive/wait pair carries the handoff. That producer/consumer overlap brought it to about 30.
Thirty TFLOPS is a respectable warp-specialized FP8 kernel. Getting to 108 took a different kind of move.
The VT-GMEM Layout
The FP8 MMA wants its operands in a specific register layout, one lane holding a specific set of the matrix's elements, and the naive path pays for that layout twice. The V tile arrives from shared memory in the arrangement the load produced, and the mma instruction expects a different arrangement, so every iteration of the inner loop does a per-thread transpose in registers (shuffles and selects) before it can issue the matmul. At BF16 issue rates you can sometimes hide that. At FP8 rates, where the MMA itself is twice as fast, the transpose stops hiding. It sits on the critical path and it scales with the inner loop, so the faster you make the matmul the more the transpose dominates.
V12c stores V already transposed in global memory, the layout I call VT-GMEM, so the load delivers operands in exactly the arrangement the MMA consumes. The per-thread shuffle disappears entirely. The kernel stops paying a tax it was paying every single iteration, and FP8 throughput jumps to roughly 108 TFLOPS. The transpose moves out of the hot loop and into a one-time layout choice at the boundary. That is the second lesson, and the most important one: on this chip, layout beats scheduling. I spent versions V3 through V11 improving how work was scheduled and got from 10 to 30. One change to how the data was laid out got from 30 to 108.
The Red Herring That Cost a Week
The VT-GMEM V tile has shared-memory bank conflicts. They show up clearly in Nsight Compute (the L1/TEX pipe is the top throughput limiter at 88% of speed-of-light), and the textbook response is to swizzle the shared-memory layout with an XOR permutation so that the conflicting accesses spread across banks. I wrote the swizzle. It made the kernel slower, and not by a little. The conflicted VT-GMEM layout runs 2.3 to 3.2× faster than the bank-conflict-free swizzled version.
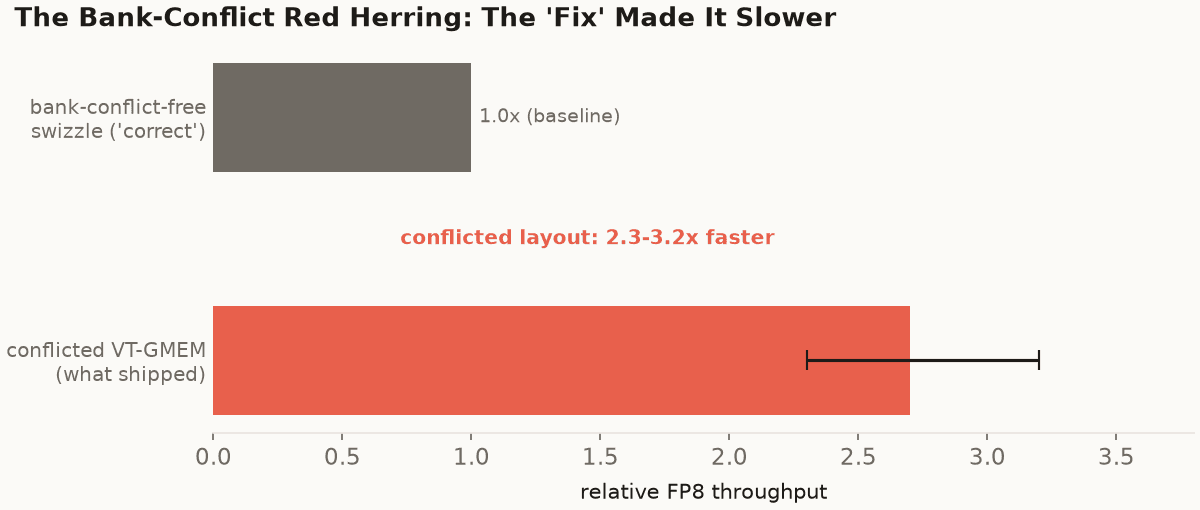
The bank-conflict 'fix' made it slower. The VT-GMEM layout has shared-memory bank conflicts that Nsight Compute flags clearly; swizzling them away cost 2.3-3.2x because the conflict-free layout no longer delivered operands in the order the MMA consumes them. The profiler told the truth (L1/TEX-bound); the textbook inference from it was wrong.
The reason is that the conflicted layout is the one that hands the MMA its operands in the right order. Swizzling to remove the bank conflicts destroys that alignment and reintroduces exactly the per-thread shuffle VT-GMEM existed to delete. The bank conflicts are real, the profiler is right that L1/TEX is the limiter, and paying them is still the fastest design, because the alternative costs more somewhere the profiler's top-line number doesn't point at. The lesson is one I keep relearning: the optimization the profiler points you toward can still be wrong; the profiler tells you the truth but not the inference. The bank-conflict count is a fact; "therefore remove the bank conflicts" is a hypothesis, and on this kernel it was false.
The Numbers, and the Baseline That Isn't There
DGX Spark (GB10, sm_121a), D=128, non-causal, FP8 e4m3 inputs, CUDA-event median:
Shape | spark-kernels V12c |
|---|---|
B=2 H=32 S=2048 | 107.5 TFLOPS |
B=2 H=32 S=4096 | 94.1 TFLOPS |
B=2 H=32 S=8192 | 108.6 TFLOPS |
Roughly 108 TFLOPS at the ends, with a dip to 94 at S=4096 that I have not run down. It is almost certainly a tile-quantization effect at that sequence length. The more interesting part of this section is the column I could not fill.
I went to benchmark the baselines you would reach for, and ran out of baselines. cuDNN 9.19 has a BF16 fused-attention engine for sm_121 and builds one without complaint. Ask it for the FP8 variant and it returns cudnnGraphNotSupportedError: no valid engine configs for smVersion 1210. There is no FP8 fused-attention engine for this chip. CUTLASS's CuTe DSL cannot lower the FP8 MMA at all (#3044). gau-nernst's reference is BF16 only. flash-attention's SM120 FP8 path is a KV-decode GEMV, not a prefill forward. So the claim is not "fastest," which would invite a cherry-picking read. It is narrower and, I think, more interesting. As of mid-2026 this is the only exact-FP8-input flash-attention forward I can get to run on sm_121a at all. The vendor library won't build one and the dominant open toolchain can't compile one. (The cuDNN result reproduces from scripts/bench_cudnn_fp8_fa.py: the BF16 graph builds, the FP8 graph throws.)
FP8 was winnable for exactly the reason BF16, next, is not. The instruction is new enough that the compiler hasn't caught up to it on SM120, and "the compiler hasn't caught up" is precisely the seam where dropping to PTX pays. You are not out-optimizing a mature toolchain. You are filling a hole it hasn't filled yet.
BF16: Where the Toolchain Wins
If FP8 is the seam where dropping to PTX pays, BF16 is the place it doesn't. The BF16 MMA on SM120 is m16n8k16, the same SM80-era instruction the ecosystem has had for years. The compiler paths for it are mature: CUTLASS's CuTe DSL generates well-pipelined BF16 kernels, and cuDNN ships a tuned BF16 fused-attention engine that builds without complaint on sm_121. There is no gap to fill here, and the numbers say so.
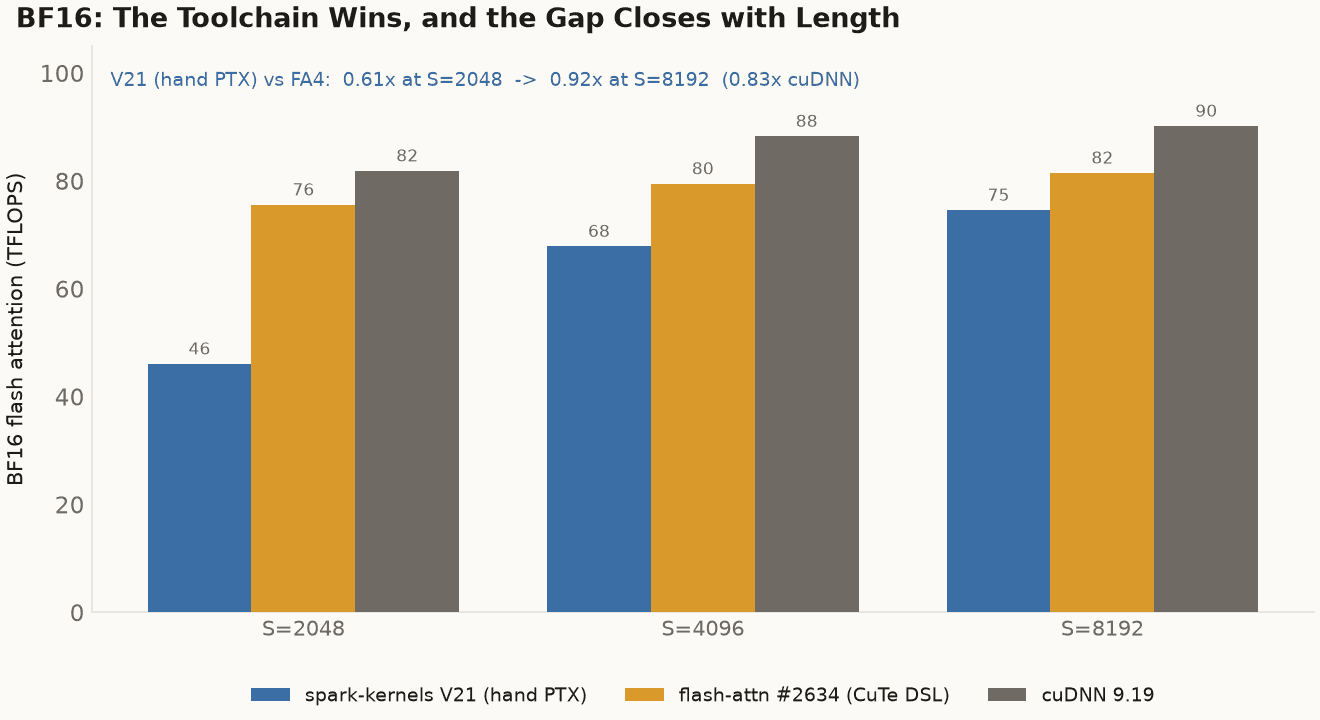
BF16 flash attention, same box and session, B=2 H=32 D=128 non-causal. Our hand-PTX V21 loses to both the CuTe DSL kernel and the vendor library, and the gap is occupancy, not structure: it closes from 0.61x to 0.92x of flash-attn as the sequence grows and the large per-CTA tile finally has enough work to amortize.
Our V21 loses, and it is worth being precise about how, in the same absolute terms the win got. On the same box and session (B=2, H=32, D=128, non-causal) V21 sustains 46.1 TFLOPS at S=2048, 67.9 at S=4096, and 74.6 at S=8192; the chart above sets those against the baselines. At short sequences that is well behind, 0.61× of flash-attn at S=2048. The gap is occupancy, not a property of hand-written PTX. V21 carries a large per-CTA tile to keep the MMA fed (82 KB of shared memory, which is most of the 99 KB SM), so it runs one block per SM, and at small problem sizes there isn't enough work to amortize the launch and pipeline-fill cost across that one block. As the sequence grows the kernel gets the work it wants and the gap closes steadily, to 0.92× of flash-attn and 0.83× of cuDNN at S=8192. The production traffic that matters is long-context, and there V21 lands within roughly ten percent of the mature CuTe-DSL kernel and within twenty of the vendor library, both of which have had years of tuning.
I tried to close it by hand, and the two levers that didn't work are the useful part. First, register double-buffering of the ldmatrix loads, which prefetches the next tile's operands into registers while the current MMA runs. The PTX I wrote for it produced identical SASS to what I already had; ptxas was already scheduling that prefetch, and my "optimization" was a no-op the compiler had beaten me to. Second, a smaller tile to raise occupancy: half the shared-memory footprint, two blocks per SM, double the occupancy. It ran 12% slower, because the smaller tile feeds the MMA less efficiently and the occupancy gain didn't pay for the throughput loss. Then I built the thing those two failures pointed at, V22, a four-buffer software-pipelined kernel that overlaps loads and MMA across four stages by hand. It worked, in that it beat V3, but it landed short of V21 and far short of the compiler. I wrote a more sophisticated kernel and it still lost to CuTe DSL's auto-generated pipeline. The conclusion is that closing this gap needs the full async-multi-stage machinery the compiler emits for free, and that may simply not be reachable by hand under the 99 KB shared-memory and warp-level-mma.syncconstraints. It is also not worth it, because the FP8 kernel is the one production runs and the one the toolchain can't provide.
That is the other half of the thesis. Hand-written PTX does not beat a mature toolchain at its own game; it ships the kernel the toolchain hasn't shipped yet. BF16 attention is not that kernel. FP8 attention, on this chip, still is.
GEMM: A Second Optimization Journey
Flash attention got the headline, but the same arc played out in GEMM, and it's worth telling because the two endpoints land on opposite sides of the thesis again.
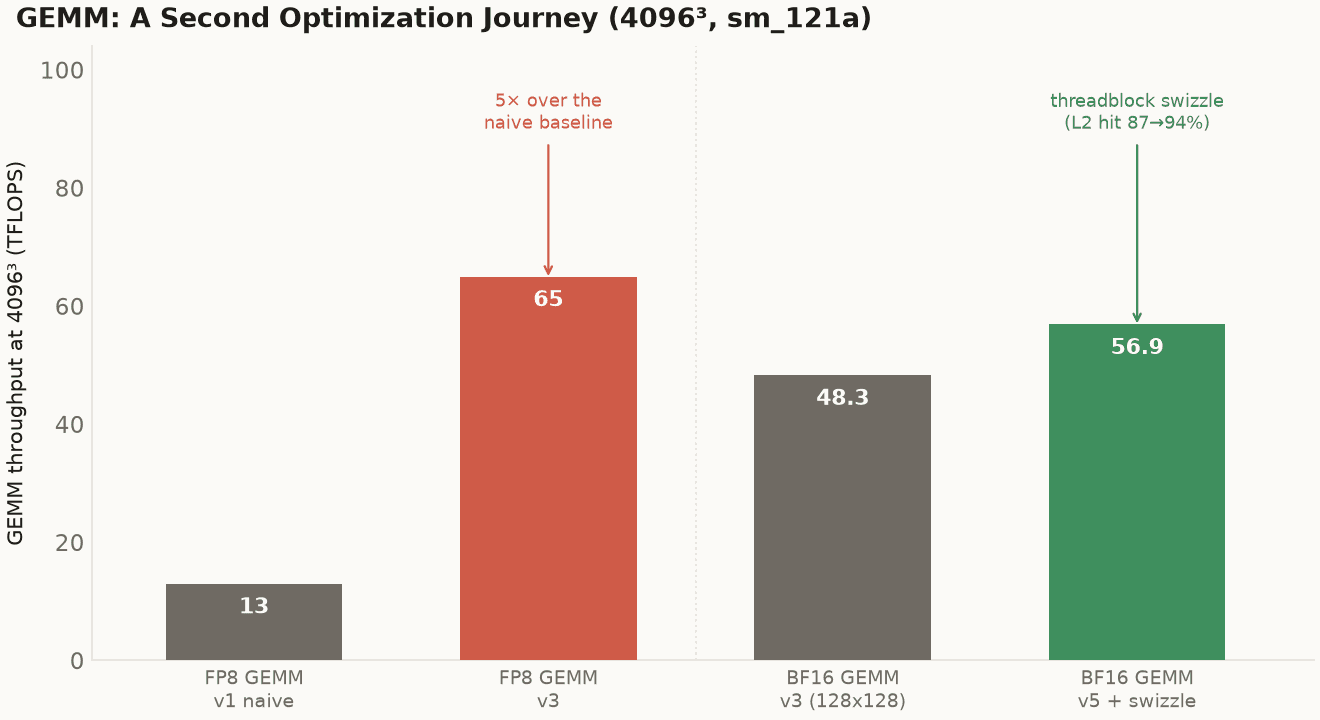
Two GEMM journeys at 4096^3. The FP8 GEMM climbed 5x from a naive baseline and has no CuTe-DSL competitor on SM120 (the same #3044 that blocks FP8 attention blocks FP8 GEMM). The BF16 GEMM's last win was a threadblock swizzle (reorder which CTA computes which output tile so neighboring CTAs reuse L2), which lifted the L2 hit rate from 87% to 94% and turned a regression into a clean win.
The FP8 GEMM is the FP8-attention story again, for the same reason. CUTLASS's CuTe DSL can't lower the FP8 MMA on SM120 (#3044 blocks GEMM exactly as it blocks attention), so there is no compiler-generated FP8 GEMM to lose to. Hand-written, the kernel climbed from 13 TFLOPS naive to 65 TFLOPS at 4096³, a 5× gain and 26% of the measured FP8 tensor peak. The hand-PTX-fills-the-gap pattern isn't specific to attention. It follows the FP8 instruction the toolchain can't emit, wherever that instruction is needed.
The BF16 GEMM is the mature-instruction story again, and its last useful win is my favorite small result in the library. The best BF16 GEMM (v3, a 128×128 tile) capped at ~48 TFLOPS, occupancy-bound. The rewrite (v5, a 128×256 register-blocked tile carrying 64 FP32 accumulators per thread) had more arithmetic per CTA but ran one block per SM at 168 registers per thread, and at 4096³ it initially regressed, because the bigger tiles thrashed the L2. The fix wasn't in the math at all. It was a threadblock swizzle: change the order in which CTAs are assigned to output tiles, so that CTAs running concurrently touch nearby regions of the input matrices and hit in L2 instead of evicting each other. That single reordering lifted the L2 hit rate from 87% to 94% and turned the regression into a clean win: ~57 TFLOPS at 4096³, +12 to 20% over v3, and the new BF16 GEMM best in the library. Same lesson VT-GMEM taught in FP8: the win was where the data went, not what the math did. I changed which core computed which tile, and nothing else, and the kernel got 16% faster.
v5 ships bit-identical to v3 (the swizzle is a scheduling change, not a numeric one, so it preserves the deterministic-build guarantee), routed in only at the large shapes where it wins; the production prefill shape stays on v3. And it's still occupancy-bound at one block per SM, the same wall as everything else here, which the roofline section makes general.
GDN in PTX, and the Bug I Caught on Myself
The model these kernels serve is a hybrid, and most of its layers are not attention at all: three quarters of them are gated delta-net (GDN), a linear-attention variant that carries a fixed-size recurrent state instead of a growing KV cache, with a full-attention layer every fourth. To serve such a model from hand-written PTX I had to write GDN kernels too: a chunked-prefill kernel that scans the prompt, and a decode kernel that advances the recurrent state one token at a time. As far as I can tell these are the first hand-written PTX GDN kernels for SM12x. The implementations I know of are CUDA C++ (the other open GB10 inference engine ships a GDN/Mamba-2 kernel) or Triton (the flash-linear-attention library's chunk-GDN, and NVIDIA's reference Gated DeltaNet, written for Hopper's WGMMA). None of them is hand-written PTX. That's the cut I'm claiming, not that nobody has run GDN on this chip.
The decode kernel is a recurrent state update and it profiles like one. At serving batch (128 sequences, 32 value heads, a 128×128 state per head) it sits at 86% of the memory pipe and 5% of the tensor pipe: almost no math, just moving state in and out. Useful bandwidth lands near 60 GB/s, well under the 273 GB/s ceiling, because the 128×128 recurrent-state access doesn't coalesce cleanly, and it hits the same occupancy wall as everything else here, with the state tile pinning it to one block per SM at about 8% occupancy. It is correct and it's the first of its kind on this chip, but I would not call it optimized. The headroom is in the access pattern, and I haven't chased it. The more useful part of this section is the bug.
During one of my kernel audits, checking each kernel against its Hugging Face reference, the GDN pair didn't line up. The recurrence at each step is a gated delta rule: the new state is the old state plus an outer-product correction, S' = S + β·k·(v − α·(S·k))ᵀ, where α is the per-step gate decay and β the write strength. The decode kernel applied the gate decay before the state update (its inner term was v − α·(S·k)), matching Hugging Face's recurrent_gated_delta_rule to tolerance zero. The prefill kernel computed v − (S·k). Same recurrence, two implementations, and only one was right: prefill was missing the α factor, on every GDN layer of every prompt.
It survived because the tests couldn't catch it. Both kernels had golden-vector tests and both passed, but the golden vectors had been generated with the same no-alpha math the prefill kernel used. The test for the buggy kernel encoded the bug. The decode test passed for a different reason: it checks a single token, where one step of missing decay stays under tolerance. So the suite was green over a real, production-served discrepancy. The test can encode the bug. A golden vector is only as correct as the reference that produced it, and "all tests pass" means "consistent with my assumptions," not "correct."
Then the question every engineer should ask: how wrong, actually? On the synthetic golden inputs the divergence looked catastrophic, 500% on one shape and 6000% on another, because those inputs use unbounded random keys and the per-step error compounds through the recurrence. But production l2-normalizes the keys and queries before the GDN layer, which bounds the per-step error, and the gate decay is contractive, so it doesn't run away: measured on normalized inputs it is about 0.1 to 0.6% mean relative error on the output, and it plateaus with sequence length rather than growing. That is why the model served at its target quality with the bug present and passed end-to-end byte-identity validation. The bug was real and the bug was small, and both are true at once.
The fix is one instruction (the same gate-decay multiply the decode kernel already has, mirrored into prefill), plus regenerating both golden vectors from the Hugging Face math and tightening the tolerances so they can actually tell the two recurrences apart. I built and validated the corrected kernel against the HF reference but did not flip it on by default, because changing prefill changes the state the model ingests, which changes served output, so it's gated behind a flag pending a quality re-eval. Found, measured, fixed, gated, not yet deployed.
I include it because the alternative, quietly correcting it and never mentioning it, is how a library's numbers stop meaning anything.
That audit taught two more things worth passing on, both about not trusting the wrong tool. The static-analysis pass over the kernels flagged several shared-memory races: a P-store aliasing a K-read with an insufficient barrier in the prefill kernel, and a write-after-read on the GDN query buffer. Read by eye, they looked real. Run under compute-sanitizer --tool racecheck, every one came back with zero hazards. The races weren't there; the static reading couldn't see the barrier that made them safe. On a chip with no SASS assembler, the hardware tools (racecheck, synccheck, memcheck) are the ground truth, and code-reading is a hypothesis generator, not a verdict. The second thing was dumber and cost more time: a batch of tests "failed" in a way that looked like a cross-test state leak, and I chased it as a kernel bug for an afternoon before finding that the test runner had picked a months-stale binary (it sorted the build hashes alphabetically and grabbed an old one). Selecting the newest binary by mtime, everything passed. The phantom bug was in my harness, not my kernel. Lesson filed: select test binaries by mtime, and suspect the environment before the kernel.
The Library Also Trains
Everything above is inference. But the same chip runs fine-tuning too, and a serving-only kernel library would mean training falls back to the slow path on the very hardware meant to run it fast. So the backward pass is hand-PTX too, and correctness there matters more than anywhere else: training kernels are where a quiet numerical error becomes a model that subtly won't converge.
The backward surface is 1:1 with the forward one: backward flash attention across causal, GQA, varlen, paged, and FP8-KV, with dQ/dK bit-exact against PyTorch autograd and dV within the BF16 noise floor (its reduction runs over the whole sequence in a different order than autograd's, so it lands within noise rather than bit-for-bit); backward GEMMs that hit 21× forward, 22.6× backward, and 11.8× on a full step over the scalar reference, by routing the backward through the same MMA path as the forward kernels via a transpose. That scalar reference is the library's own non-tensor-core implementation, the one each kernel is validated against, not a tuned vendor library, so these are MMA-versus-naive ratios.
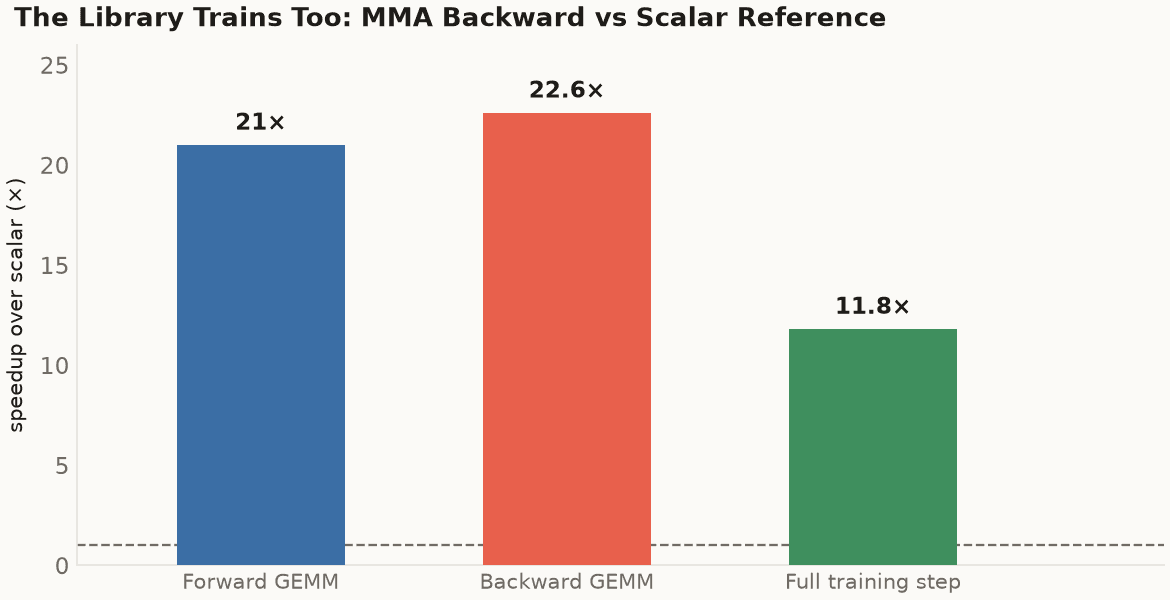
The training kernels route the backward pass through the same MMA path as the forward kernels (via a transpose), for 21× on the forward GEMM, 22.6× on the backward, and 11.8× on a full training step over the scalar reference (the dashed line at 1×), while staying bit-exact: dQ/dK match PyTorch autograd, AdamW's weight is bit-exact to a reference, LAMB within 1.9e-9 of an f64 reference.
On top of that sit the optimizer and quantization kernels a real training loop needs: AdamW with a BF16 weight and FP32 master copy (weight bit-exact to a reference implementation, the moments within one or two ULP), LAMB (within 2e-9 of an f64 reference), QAT fake-quant for FP8 e4m3 both per-tensor and per-channel with a straight-through-estimator backward, and the gradient plumbing (FP32 accumulation, L2-norm clipping, a loss scaler). Dozens of training tests gate it, and the end-to-end demos close real loops: a single linear layer drops its loss 183× over 50 AdamW steps, a two-layer MLP 11×. None of this is glamorous and none of it is a headline TFLOPS number. It's the half of the library that's easy to skip and expensive to skip wrong.
The Long Tail Is Most of the Library
Everything above is the highlight reel, the kernels with the best arcs. But those flagships are five kernels (the two flash-attention kernels, the two GEMMs, and GDN decode) out of close to 280, and a library is judged on its coverage, not its best kernel. The other 275 are not filler and they're not auto-generated; each family below was a design problem I had to think through, and the thinking is the point. So rather than list them, here is how the bulk of the library was reasoned out, family by family.

The 280 hand-written kernels by family (an exhaustive bucketing of the .visible .entry points). The five headline kernels in this post live in the attention, GEMM, and sequence-model families (orange); the bulk of the library is the long tail: elementwise and norm/RoPE, KV-cache management, the MoE routing pipeline, quantization, sampling, optimizers, and the frontier primitives.
Attention Is a Grid, and Every Cell Is a Decision
The flash-attention surface is a cross-product of dtype and variant (91 of the 280 kernels), because a single serving model hits most of the cells at once:
Variant | BF16 | FP8 | Why it exists |
|---|---|---|---|
Dense / causal / GQA | ✓ | ✓ | the base cases |
Paged KV | ✓ | ✓ | serving KV-cache management |
Split-KV (FlashDecoding) | ✓ | ✓ | fill the machine at single-user long-context |
Varlen (ragged batch) | ✓ | — | batch uneven sequences without padding waste |
Sliding-window + logit softcap | ✓ | — | the Gemma/Mistral-class local-attention layers |
MLA (compressed-KV latent attention) | ✓ | ✓ decode | DeepSeek-class models |
Tree (speculative / Medusa-style) | ✓ | — | verify many draft tokens in one pass |
Sparse (NSA-style block selection) | ✓ | — | attend over selected blocks only |
+ the full backward pass for each | ✓ | ✓ | training |
The reason this is 91 kernels and not one parameterized monster is that a few design decisions recur and each forces a real fork. All of it is built on the SM80 instruction base, because SM121 has no tcgen05, so the tiles had to be re-budgeted for the 99 KB SMEM (the SM80 base assumes ~64 KB, SM90 assumes 228 KB, and neither fits). Split-KV had to keep its partial sums in FP32, not FP16, because the FP16 combine drifts observably on long sequences once you're adding many splits. Paged KV uses non-TMA scatter/gather, because TMA's contiguous descriptors can't express a per-page address computation. You do the page-table lookup in code and cp.async the transfer. None of these is visible in a feature checkbox, and all of them are the actual work.
Linear-Time Sequence Models: The State Is the Design
Not every layer is attention. GDN and Mamba-2 carry a fixed-size recurrent state instead of a growing KV cache, and that single fact drives the whole family (21 kernels). The decode kernel advances the state one token at a time, which is memory-bound, as the flagship GDN section showed. Prefill is where the design choice lives: you can run the recurrence sequentially (O(L), simple, slow) or as a chunked scan that does the within-chunk work in parallel and only carries the state across chunk boundaries. The library ships the chunked scan, because prefill throughput is what a long prompt actually waits on. Around the recurrence sit the pieces the gated and SSM layers need: the short causal conv1d+SiLU that precedes the gate (its own fused kernel, forward and backward, and a chunked variant so prefill doesn't serialize on it), and gated-RMSNorm-SiLU, which fuses the norm, the gate, and the activation into one pass so the activations never round-trip to HBM. The guiding rule across this family is the same one VT-GMEM taught: on a bandwidth-bound chip, fuse until the intermediate tensors never leave the SM.
The GEMM Dtype Ladder: Pick the Format by the Bound
The 51 GEMM/GEMV kernels look like redundancy until you notice they're a ladder of precision-versus-bandwidth tradeoffs, and a real model picks a rung by its bottleneck. BF16 is the reference and the training path. W8A16 (BF16 activations, FP8 weights, dequantized in SMEM after load) is the bandwidth win for dense decode, where you're weight-bound and halving the weight bytes directly buys tokens. W4A16 goes further on paper, but as the negative-results section covers, the 4-bit dequant tax can exceed the bandwidth saving and flip the kernel compute-bound, so it's a rung you take only when the shape supports it. Grouped per-expert GEMM (BF16, FP8, MXFP4) is the MoE case, where each expert is a small matmul and the win is batching them; its fastest variant reaches 11.1 TFLOPS, low in absolute terms precisely because those per-expert matmuls are small, so the gain is in batching many tiny GEMMs rather than peak throughput. And 4-bit is the top of the ladder. SM121 has a genuine NVFP4 MMA (kind::mxf4nvf4: e2m1 elements with an FP8 E4M3 scale per 16, which is what makes it NVFP4 rather than MXFP4's E8M0 scale per 32), and the microbench puts that instruction at 493 TFLOPS, the 4× roofline line. The library has a dense NVFP4 GEMM that is correct against the reference; closing the gap from correct to that ceiling is where the next post's headroom lives. CUTLASS exposes SM120 NVFP4 only through a sparse C++ example, with no CuTe-DSL dense kernel, so this is one more thing the toolchain won't generate for you. The thought process across the whole ladder is one sentence: quantization is never free, and you choose the format by which wall you're against.
Quantization, the Unfashionable Half of Quantization
Sixteen kernels just convert between formats, and they exist because every model family standardizes on a different one (FP8 1×128 block-scaled, NVFP4, MXFP4, MXFP8), and you cannot load a real checkpoint without the matching quant and dequant. The design choice that recurs here is to fuse the quantize with the store (quantize and write in a single kernel rather than materializing the high-precision tensor first), and to lay the block scales out so the consuming GEMM reads them without a gather. Unglamorous, load-bearing, and the reason the GEMM ladder above can actually be fed.
The Supporting Cast: Required, Fused, Numerically Fussy
Forty-odd kernels are the parts no blog post leads with and no model runs without: RMSNorm, RoPE, SiLU/GeLU, embedding lookup, cross-entropy (forward and backward), top-k/top-p sampling, the split-K flash-decoding combine. The design thread through them is fusion and numerical care: gated-RMSNorm-SiLU is three ops in one kernel, the norms accumulate in FP32 even with BF16 I/O, the softcap is its own fused variant because bolting it on afterward costs a pass, and the sampling path got the multi-block masked-argmax optimization because at decode every microsecond is on the critical path. They're a long list precisely because correctness here is cheap to get almost-right and expensive to get exactly right.
The Frontier Primitives: Built Ahead of Need
A handful of kernels exist because the next wave of models will want them, not because anything in production needs them today: a DSA-style sparse-attention indexer (the learned top-k position selector the newest DeepSeek-class models use), the NSA selection pipeline, and an Engram conditional-memory lookup (multi-head hashing plus a gated table read) that, as far as I know, nobody else has written for SM12x. These are correctness-validated reference kernels, deliberately not optimized; I'm listing them as coverage and as intent, not as wins.
Two Honest Qualifiers
First, the test gate: every one of these is checked against a PyTorch golden vector, 184 of them across more than 500 tests, so "it exists" means "it matches the reference numerically," not "it compiles." Second, the perf is tiered: the flagships (FP8/BF16 FA, the GEMMs, GDN decode) are MMA-optimized and carry the numbers in this post; most of the long tail (MLA, Mamba-2, the sparse and frontier kernels) is correctness-validated at reference speed, with MMA optimization tracked but not yet done. Coverage first, then speed where it pays.
One long-tail kernel earned a real perf story, so it gets one: MLA decode with split-K, up to 7.54× over scalar. Multi-head latent attention has a decode problem: a single user's one query token can't fill 48 SMs, so most of the machine idles. FlashDecoding splits the KV reduction across SMs and combines the partials, worth up to 7.54× at single-user long-context (16-way split), byte-exact to the scalar reference. The split count drops as batch and head count grow, because once the SMs are busy there's nothing left to split for. And it had its own dead end: an earlier variant that packed 16 heads per CTA to share the compressed-KV load ran 7× slower (too many registers per CTA, occupancy collapsed) before the split-K-plus-MMA design (a 4.5× rewrite of the inner GEMM) turned it around.
The point of the list isn't the individual figures. It's the difference between shipping one fast kernel and shipping the kernels a model actually needs, and this library is the second.
The Roofline, and the Walls I Didn't Beat
Here is where all the kernels sit relative to the silicon, on one chart.
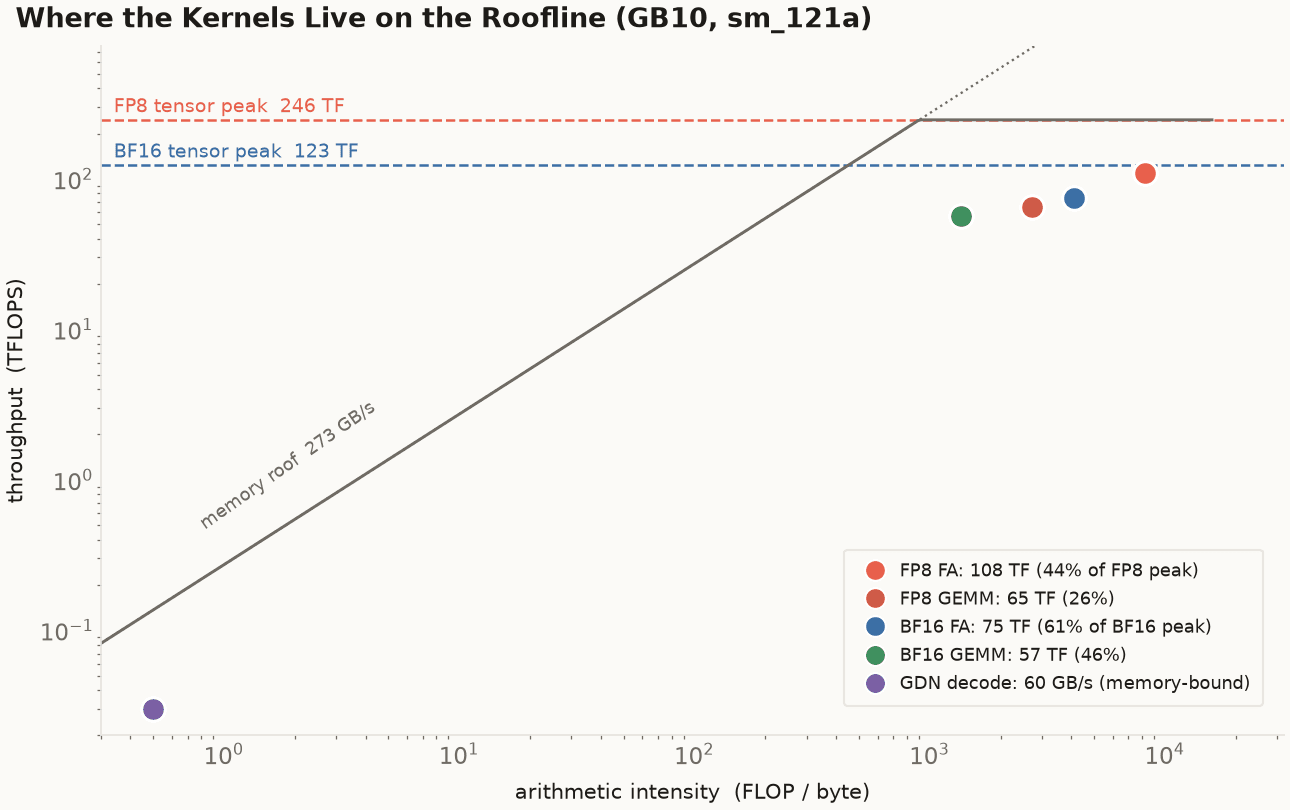
Roofline for the GB10. The tensor-core ceilings (123 TFLOPS BF16, 246 FP8) come from a register-resident MMA microbench; the memory roof is the 273 GB/s unified LPDDR5x. The flash-attention and GEMM kernels are deep in the compute-bound regime, far right of the ridge, and still land below the ceiling. GDN decode is the lone memory-bound kernel, down on the diagonal. Arithmetic intensity is derived from the standard FA/GEMM FLOP and byte counts.
The ceilings are measured, not spec-sheet. A register-resident MMA microbench (operands already in registers, so it's pure tensor-core issue rate) puts the silicon at 123.3 TFLOPS BF16 and 246.5 FP8, a clean 2.00× for the half-width type, which means GB10's FP8 path is not rate-limited the way some consumer parts are. (NVFP4 microbenches at 493 TFLOPS, a 4× line, which is where the next post's headroom lives.) Against those ceilings: FP8 FA at 108 is 44% of the FP8 peak, BF16 FA at 75 is 61% of the BF16 peak, the best BF16 GEMM at 57 is 46%. Every flagship is well short of its ceiling, and the reason is the same in every case.
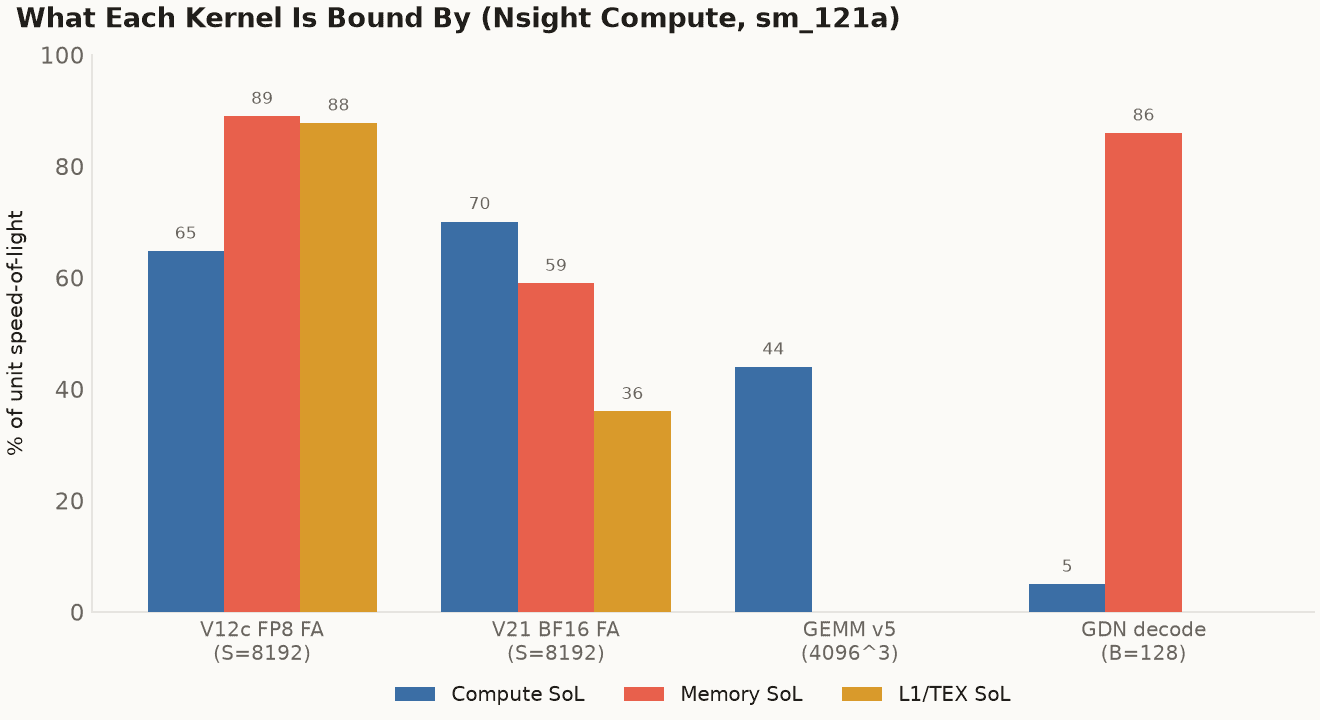
What each kernel is actually bound by, from Nsight Compute at the headline shapes. FP8 FA is L1/TEX-bound (the VT-GMEM bank conflicts, the accepted cost of the fastest layout). BF16 FA is compute-bound. GDN decode is memory-bound. GEMM v5 is register-bound, so its compute speed-of-light reads low while nothing else is saturated.
The profiler is blunt about the cause: every flagship is capped at roughly one block per SM, 8 to 21% occupancy. But each one hits that cap for a different reason, which is what makes it a hardware story rather than a tuning story.
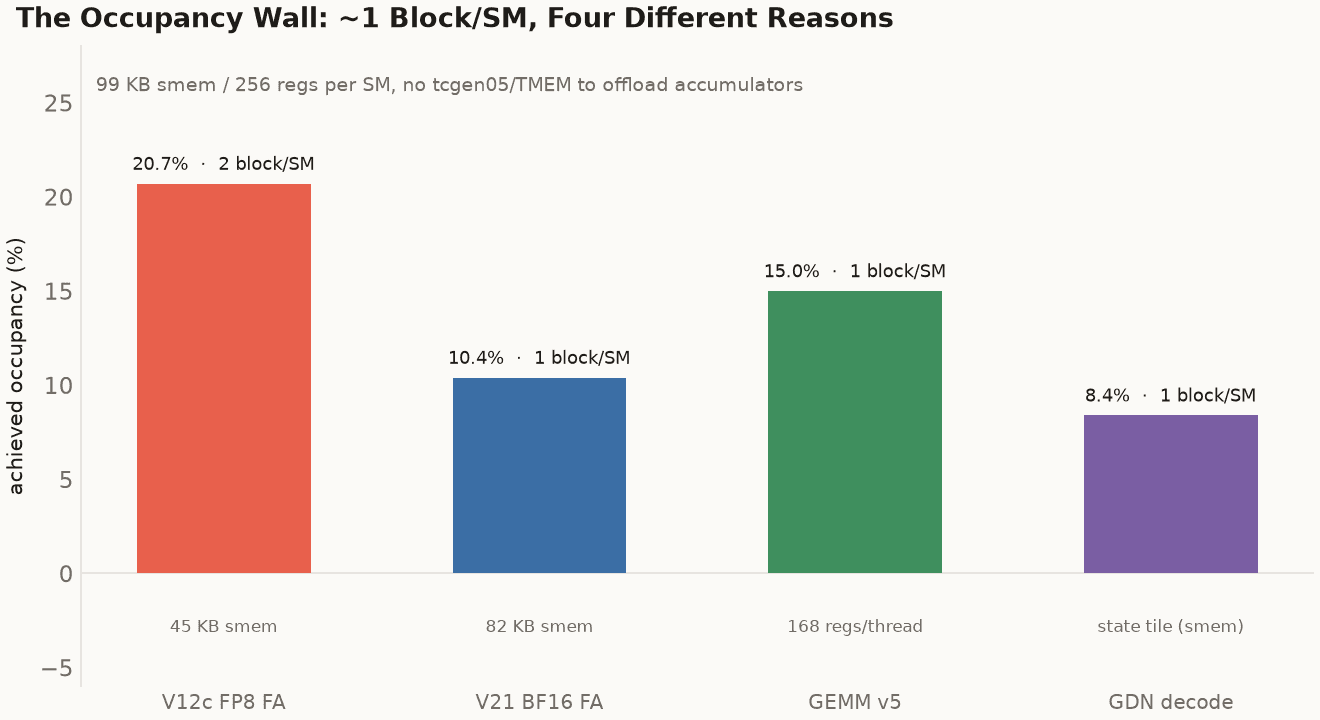
The occupancy wall: every flagship runs at about one block per SM, for four different reasons. FP8 FA and BF16 FA are limited by shared memory (45 KB and 82 KB of the 99 KB SM); GEMM v5 by registers (168 per thread for its accumulator tile, with zero shared memory); GDN decode by its recurrent-state tile. Datacenter Blackwell escapes this with tcgen05 and tensor memory, which hold accumulators off the register file and the SMEM budget. SM121 has neither.
GEMM v5 is pinned by register pressure (168 registers per thread for its 128×256 accumulator tile, with zero shared memory), so it gets one block per SM at 15% occupancy. The flash-attention kernels are pinned by shared memory instead: V21's 82 KB tile and V12c's 45 KB tile each leave room for only one or two blocks in the 99 KB SM. GDN is pinned by its state tile. Same wall, four doors to it. Datacenter Blackwell walks around the wall with tcgen05 and tensor memory, which hold the matmul accumulators in a separate memory space, off the register file and out of the shared-memory budget, so a kernel can carry a big accumulator tile and keep occupancy up. SM121 has neither. So the gap to the tensor peak is a hardware wall (no TMEM to offload accumulators), not a tuning miss, and knowing which wall you're against is what kept me from spending another month chasing a few percent the silicon will not give up.
Two more walls, briefly. The BF16 attention gap is the one above: the compiler's async-multi-stage pipeline beats hand PTX and I couldn't close it by hand. And several earlier flash-attention variants (V8, V11, V12) use more than 90 KB of dynamic shared memory and crash on the Spark after the unified memory fragments. That is a platform limitation, not a kernel bug, with V21 (82 KB) as the production replacement. I note it because someone will try those variants and hit it.
Determinism at the Kernel Level
This part is not novel. Thinking Machines Lab's Defeating Nondeterminism in LLM Inference (Horace He, September 2025) is the reference for the root cause: batch-size variance in the core kernels, not GPU concurrency, is why the same prompt yields different tokens run to run, and batch-invariant ops fix it. vLLM ships those ops mainline now, and a follow-on paper (Zhang et al., 2025) demonstrated deterministic, bitwise-reproducible inference through vLLM and validated it on, among other GPUs, an RTX PRO 6000, which is consumer Blackwell (sm_120). So the concept is settled, and it has already been shown on this class of hardware through the framework's Triton kernels. What's new here is doing it one layer down, at the SM121 hand-written-PTX kernel level. Second to bit-exactness on consumer Blackwell, first at the hand-PTX layer that I'm aware of.
The non-determinism that mattered here lived in the split-K GEMM. When the reduction over K is split across blocks and combined with atomic adds, the summation order depends on scheduling and batch position, so the low bits of the logits move, and with sampling that flips tokens. Under SPARK_DETERMINISTIC=1the library swaps in a split-K with a fixed reduction order and captures the deterministic kernels in a CUDA graph (the capture matters: it pins the launch order, which is the other source of run-to-run drift).
The result, on a fixed serving configuration: 16 identical seeded requests that produce 14 distinct completions by default collapse to 1 with the flag on, and greedy output is character-identical run to run. The cost is small. The deterministic split-K started at 1.66×, CUDA-graph capture removed a residual 14%, and the steady-state decode penalty is now about 4% (82 to 85 ms/token). Bit-exactness for roughly the price of nothing is the point: it's what makes RL rollouts and evals reproducible, which is the whole reason to run a model on hardware you control.
One boundary worth stating. The guarantee is per serving configuration. The serial and batched paths sample through slightly different code, so a given seed can produce different output depending on which path served it; each path is individually bit-exact. Closing that cross-path gap is a serving cleanup, not a kernel-determinism question, and I haven't done it.
What Didn't Work, Kept on the Record
Scattered through the post are dead ends, and I want to collect a few more in one place, because the negative results are the part a kernel engineer can actually use: they're the experiments you don't have to re-run.
CUDA-graph capture of a mixture-of-experts FFN: −15%. Graphs remove kernel-launch overhead. But that FFN is weight-bound: the bottleneck is reading the expert weights from memory, and the launch overhead was already hidden behind the GPU's async pipelining. Capturing it added graph overhead and removed nothing on the critical path. (The same capture is a win on a smaller, less weight-bound MLP, which is the whole point: the technique isn't good or bad in the abstract, it's good or bad for a given bound.)
4-bit weights for a dense MLP: −16%. Swapping W8A16 (8-bit weights) for W4A16 NVFP4 (4-bit) should, on paper, halve the weight bandwidth. It ran slower, because the 4-bit dequant (unpack the nibble, apply a per-16-element FP8 block scale) costs more compute than the bandwidth it saves at that shape, flipping the kernel from bandwidth-bound to compute-bound. Lower precision is not automatically faster; the dequant tax is real and shape-dependent. And the existing test only checked correctness, so nothing flagged the regression, the same blind spot as the GDN goldens in a different costume.
Self-speculative decoding that helped the base model but not the fine-tuned one. MTP-style draft heads gave the base model roughly 1.1× on decode and the fine-tuned adapter roughly 1.0×. The heads had learned the base model's next-token distribution; after fine-tuning shifted that distribution, the draft acceptance rate fell far enough to erase the gain. A speedup measured on the base model is not a speedup you've earned on the model you actually serve.
The unifying read across these and the performance_audit negatives is consistent: on SM121a, for the batch-1, moderate-shape regime, occupancy and tensor-core saturation move the needle and memory-pipeline depth tricks mostly don't. That's a property of this chip, and the only way to know it was to measure the things that didn't work.
What the Journey Taught Me
The named lessons, collected, because they're the part that transfers to anyone doing this on a new chip:
Layout beats scheduling, twice. In FP8 attention, versions V3 through V11 improved how work was scheduled (10 to 30 TFLOPS); one change to how the data was laid out (VT-GMEM) did 30 to 108. In BF16 GEMM, the last win was a threadblock swizzle (changing which core computes which tile, not the math) for a 16% gain via L2 reuse. On a chip where the tensor cores are fast and the memory system is the constraint, where the bytes land matters more than when they move.
The optimization the profiler points you toward can be wrong; it tells you the truth but not the inference. Nsight correctly flagged the VT-GMEM bank conflicts; removing them cost 2.3-3.2× because the conflicted layout was the one the MMA wanted. The metric was a fact; the fix was a false hypothesis.
TMA is not free. A bulk copy with no compute to overlap is a slower load. TMA paid only once warp specialization gave it something to hide behind.
The test can encode the bug. The GDN golden vectors validated the buggy recurrence because they were generated from the same wrong math. "All tests pass" means consistent with your assumptions, not correct. Check goldens against an independent reference.
Measure the real magnitude before you panic or relax. The GDN bug looked like 6000% error on synthetic inputs and was 0.1-0.6% in production once the inputs were normalized. Same bug, two conclusions; only the production-realistic one mattered.
Don't benchmark over training. An early FP8 re-measurement read 48 TFLOPS at S=8192; the real number on a free GPU was 108. The difference was a training job eating the shared 273 GB/s memory bus. On unified-memory hardware the GPU benchmark and everything else on the box are fighting for the same bytes, so measure clean or don't measure.
Know which wall you're against. Occupancy walls you can sometimes tune around; a missing hardware feature (no tcgen05/TMEM) you cannot. Drawing the line honestly is what stops you from burning a month on a few percent the silicon won't give up.
A more sophisticated kernel doesn't automatically beat the compiler. The hand-written 4-buffer BF16 pipeline (V22) was more elaborate than the kernel that beat it. Effort isn't throughput. Where the toolchain is mature, it usually wins, and the honest move is to use it.
Lower precision isn't free, and graphs aren't free. The 4-bit dequant tax and the weight-bound graph regression are the same shape of mistake: an optimization that looks right in the abstract, applied where its precondition (bandwidth-bound, launch-bound) doesn't hold. Check the bound before the technique.
Verify with the hardware tool, not static analysis. Code-reading flagged races that
racecheckproved weren't there. On a chip with no SASS assembler, the sanitizers are the ground truth and a code review is a hypothesis. And the environment lies too: a stale test binary and a near-OOM page cache both produced phantom "kernel bugs." Suspect the box before the kernel.
And the one that carried over from the upstreaming work: read the source, and reproduce a known-good baseline before you trust a new measurement. Most of the time I lost on this project was lost to trusting a number I hadn't earned.
How These Numbers Were Measured
Every TFLOPS and GB/s figure in this post comes from the same harness on the same machine, and the methodology is worth stating plainly, because GB10 has one wrinkle that changes how you have to report.
The hardware is a single NVIDIA GB10 (DGX Spark), compute capability sm_121a, 48 SMs, 273 GB/s unified LPDDR5x, boosting to 3.0 GHz. The software is CUDA 13.0 (ptxas V13.0.88), driver 580.126.09, and cuDNN 9.19 for the cuDNN baselines. Kernels are timed with CUDA events (cudaEventRecord around the launch, cudaEventElapsedTime after a sync), 5 warm-up iterations discarded, then 200 measured iterations for flash attention and 100 for GEMM, with the median reported. Flash-attention TFLOPS is 4·B·H·S²·D / latency (the two matmuls, QKᵀ and PV, at two FLOPs per multiply-accumulate); GEMM is 2·M·N·K / latency. The tensor-core ceilings (123 / 246 / 493) come from a separate register-resident MMA microbench, compiled with nvcc -gencode arch=compute_121a,code=sm_121a, where the operands already live in registers so the loop measures pure issue rate rather than anything memory can throttle.
The wrinkle is the clock. GB10 does not expose application-level clock locking; nvidia-smi -lgc has no effect on this consumer part, so I cannot pin the SM clock the way you would on a datacenter GPU. Instead I warm each kernel to a steady thermal and clock state before timing and report medians, and that is why every number in this post carries a "~": run-to-run clock drift is real on this hardware, so the figures are steady-state medians rather than single pinned numbers. Across repeated benchmark runs the medians reproduce to within about ±5%, the residual coming from that clock drift, page-cache state, and whatever else on the box is sharing the memory bus, which is wide enough that a gap of a few percent between two kernels is not by itself meaningful.
Baselines were measured on the same box in the same session. The spark-kernels numbers reproduce from cargo run --release --example benchmark. The cuDNN and flash-attn #2634 figures come from their own harnesses (scripts/bench_cudnn_fp8_fa.py and scripts/bench_fa4_bf16_fa.py) and are point-in-time references on this GB10 rather than something you can regenerate from this repo. Correctness is the 184 golden vectors checked against PyTorch references, and the kernels run clean under compute-sanitizer --tool memcheck.
Using It
The library is open source. It builds with cargo build --release; the only runtime dependency is libcuda.so from the driver, so there's no CUDA toolkit to install. Every TFLOPS number in this post comes from cargo run --release --example benchmark, and the correctness gates are cargo test (the kernels are checked against 184 PyTorch golden vectors across more than 500 tests). If you'd rather not touch the host toolchain at all, the Dockerfile builds a 132 MB image (Ubuntu plus the binary, no CUDA toolkit baked in) that runs the kernels through docker run --gpus all.
These kernels don't run in a vacuum. They compose into a serving path that, on this hardware, runs meaningfully faster than going through the stock open-source framework backends, which is the entire reason to write them rather than wait for the toolchain. That end-to-end story, the scheduler and batching and quantization choices that turn fast kernels into fast serving, is a separate post.
For provenance and related work: the foundational SM120/121 flash-attention kernels were upstreamed into the flash-attention library (PRs #2329 / #2330 / #2333), which the broader ecosystem now builds on. That's the previous post. The closest other open-source work on this chip is a CUDA-C++ inference engine, the Triton/PyTorch linear-attention and batch-invariance libraries, and an FP4 fused-attention kernel for SM120 that embeds its tensor-core MMA as inline PTX inside CUDA C++. This library is the whole-kernel hand-written-PTX cut: the same kernels, written one layer lower, for the seam where that pays. If your team is on consumer Blackwell and hitting the same walls, I'd like to hear about it. blake@secondnaturecomputing.com.
A note on tooling. These kernels were written with AI assistance. The architecture decisions, the debugging, and every number reported in this post were human-directed and human-verified. I mention it for the same reason I walked through the GDN bug: you should know how the work was made before you trust its results. "Hand-written" here is NVIDIA's own term for it: authored directly in PTX, the virtual ISA, rather than generated from a higher-level language by a compiler or a DSL. ptxas still lowers that PTX to SASS, as it does for any kernel, so what is written by hand is the PTX, not the final machine code. It does not mean written without tools.
Built on behalf of Second Nature Computing.